

ChatGPT for Statistics: What It Gets Right and What to Check
See what chatgpt for statistics gets right from a photo, what it can’t prove, and practical checks to verify test choices, arithmetic, and p-values.
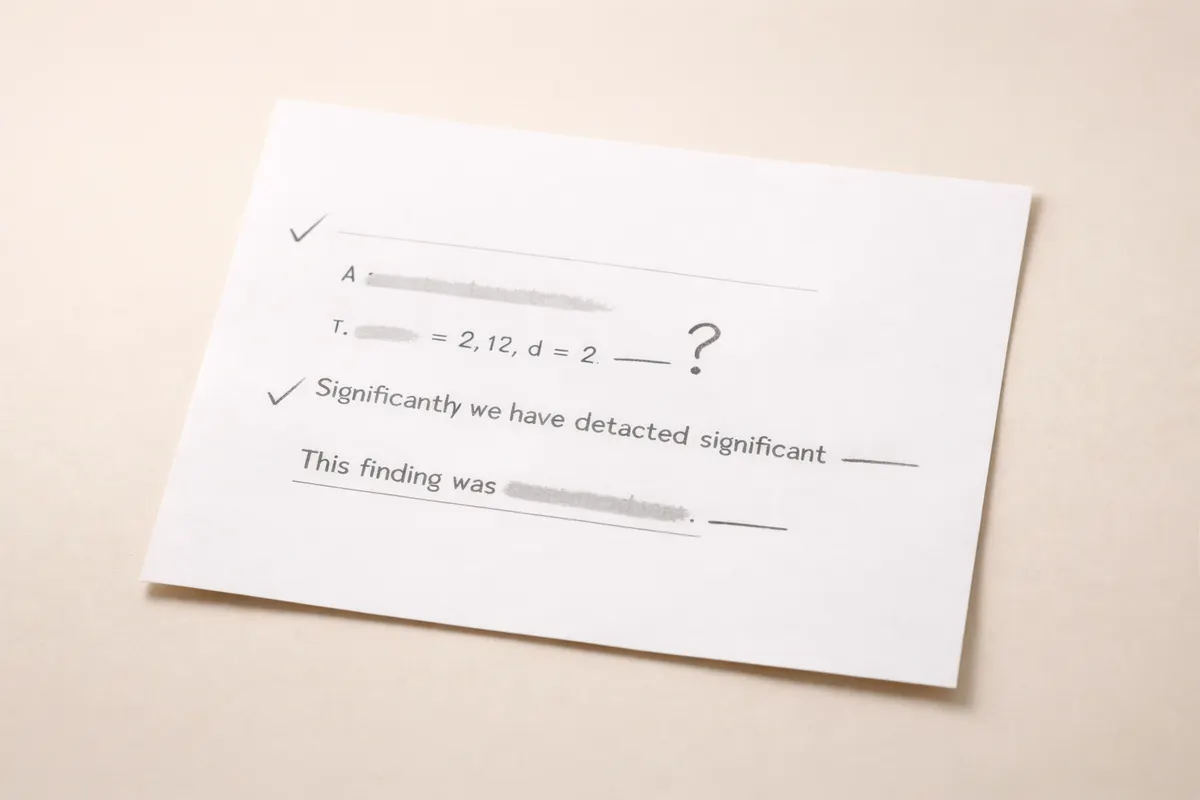
What ChatGPT can do for statistics
ChatGPT for statistics can be a fast, practical assistant for interpreting problems and listing appropriate procedures. Given a clear problem statement or a photo of a dataset or output, the model can suggest likely hypothesis tests, show required formulas, write code snippets (R, Python), and outline which assumptions to check before trusting results.
When you give ChatGPT the numbers—sample sizes, means, standard deviations, contingency counts—it can demonstrate the algebraic steps for a t-test, z-test, chi-square, or simple regression. That includes computing test statistics in symbolic form, explaining degrees of freedom, and showing how the p-value relates to the test statistic and distribution family.
ChatGPT is also useful for translating statistical jargon: it can restate a problem in plain language, recommend which visual checks to run (histogram, QQ-plot, residuals), and produce annotated code you can paste into your environment to reproduce results. For many classroom and exploratory tasks this is enough to move quickly from question to runnable code.
Because it can simulate examples, ChatGPT is helpful for understanding edge cases. Ask it to show a paired-sample calculation with small n, or to simulate how unequal variances change a t-test outcome. Those worked examples make it easier to see whether your real data meet test assumptions before you accept a single line conclusion.
- Suggests appropriate tests (t-test, chi-square, ANOVA, simple linear regression) from a clear problem statement or visible summary numbers.
- Shows formulas and symbolic arithmetic steps so you can follow the computation chain.
- Generates runnable code (R, Python) to reproduce test statistics, p-values, and confidence intervals locally.
- Explains assumptions to check (normality, independence, variance equality) and suggests diagnostic plots.
- Creates small simulated datasets to illustrate how assumption violations change conclusions.
What ChatGPT cannot prove in statistics
ChatGPT cannot prove that a typed arithmetic result matches the real-world truth from a photo, nor can it declare a dataset or output authentic. When a model shows a computed p-value or a rounded mean, treat that as a guided calculation rather than a verified number—the model may have made arithmetic mistakes, misread values from an image, or applied the wrong degrees of freedom.
The model also cannot access hidden metadata in a photo, such as raw CSV headers, missing-value encodings, or provenance that would affect trust. If the dataset contains implicit grouping, repeated measures, or measurement units that aren’t visible, ChatGPT cannot reliably infer those details and may choose an incorrect test (for example, independent-sample t-test instead of paired t-test).
Statistical conclusions depend on study design, data collection method, and context that a photo rarely captures. ChatGPT can identify plausible risks, but it cannot certify that sampling was random, that confounders were controlled, or that the effect size is practically meaningful for a specific decision.
Finally, model outputs are not deterministic in the sense of certified software. The same prompt may yield different wording or even different computational steps on repeated queries. Treat ChatGPT as a second pair of eyes that offers likely procedures and worked examples, and follow up by recomputing critical numbers yourself or with dedicated statistical tools.
- Cannot prove arithmetic on a screenshot is accurate — always recompute critical numbers.
- Cannot confirm data authenticity, provenance, or hidden measurement units from a photo.
- May choose the wrong test if pairing, blocking, or dependent structures aren’t visible.
- Is not a substitute for software that runs reproducible statistical code with exact numeric precision.
- Provides plausible explanations, not professional certification or guaranteed correctness.
Photo clues to check before trusting ChatGPT
A few reliable visual clues make a big difference when you ask ChatGPT for statistical help. Start by confirming the visible numbers: sample sizes (n), summary statistics (mean, median, SD), raw counts in contingency tables, and whether decimals or percentages are labeled. If those fields are missing or ambiguous in the photo, any calculation ChatGPT proposes is hypothesis, not verification.
Axis labels and units change interpretation. A mean of 5 could mean 5 seconds, 5 percent, or 5 occurrences per hour. Confirm unit labels, decimal separators (comma vs period), and whether the table shows aggregated counts or raw observations. Misreading units often leads a model to recommend an inappropriate test or report irrelevant effect sizes.
Look for evidence of paired observations or repeated measures—side-by-side columns with the same subject IDs, before/after labels, or 'matched' text. If pairing is visible, a paired t-test or repeated-measures approach is usually appropriate; if pairing is absent, independent-sample tests apply. The wrong choice is a frequent source of incorrect p-values.
Check the output format from statistical software in screenshots. Many packages report the test statistic, degrees of freedom, and p-value together. If a photo is a truncated screenshot missing the degrees of freedom or test type, don’t assume the rest: ask ChatGPT to show how it computed the p-value from the numbers that are actually visible and then verify those computations yourself.
- Visible sample sizes (n) and group counts — confirm before trusting test choice.
- Exact summary stats with labels (mean, SD, median) and decimal separators.
- Clear axis labels and measurement units for correct interpretation.
- Evidence of pairing or repeated measures shown by IDs or before/after columns.
- Full software output including test name, statistic, and degrees of freedom.
- Avoid inferring hidden variables or data cleaning steps that aren’t shown.
How to verify ChatGPT’s statistical steps
Verification is a three-step process: confirm visible inputs, recompute the key numbers, and validate assumptions. First, transcribe the numbers you see and double-check that transcription against the photo. Small transcription errors (like copying 12.6 as 126) are a common source of downstream mistakes.
Second, recompute the test statistic and p-value independently. If ChatGPT shows a t statistic of 2.34 with df = 18, plug those numbers into a known calculator or the R/Python code the model provided and compare outputs. For proportions or contingency tables, compute expected counts to confirm chi-square validity (expected counts preferably ≥5 for the standard test).
Third, run minimal diagnostics that the model suggested. Plot the residuals or a histogram, compute skewness or an IQR summary, and check sample balance. If assumptions fail, use the robust or nonparametric alternatives ChatGPT listed (Welch t-test, Mann–Whitney U, permutation test) and recompute effect sizes.
When the decision is high-stakes—regulatory reports, published research, clinical guidance—escalate verification. Use Statikia to re-run arithmetic steps and flag likely calculation errors from the screenshots, run your own code in a reproducible environment, or consult a statistician for study design or causal inference questions. For many routine classroom or exploratory analyses, a careful manual recompute and diagnostic plot are sufficient.
- Transcribe visible numbers exactly and re-check transcription before trusting any result.
- Recompute test statistics and p-values with a calculator or the code snippet ChatGPT provided.
- Check expected counts for chi-square, degrees of freedom for t-tests, and whether tests are one- or two-sided.
- Run diagnostic plots and compute simple summary measures (skewness, IQR, residual plots).
- If assumptions fail, switch to recommended robust or nonparametric alternatives and recompute.
- Escalate to Statikia, reproducible code, or a statistician for high-stakes or ambiguous cases.
Related guides
Verify ChatGPT steps with Statikia
Use Statikia to double-check the arithmetic and procedure ChatGPT suggested. Scan your screenshot in the iOS app to capture visible numbers and let Statikia re-run the same computations and flag likely transcription or arithmetic errors. For ambiguous test choices, Statikia highlights missing clues and suggests the most defensible next steps—so you can move from a model’s recommendation to verified results. Learn more at https://statisticsai.app/
Take the next step →Frequently asked questions
Can ChatGPT do statistics accurately?
ChatGPT can propose correct procedures, explain formulas, and show worked examples, but its arithmetic and test choices must be verified. Treat model outputs as guidance: transcribe your numbers, recompute test statistics and p-values in a reliable calculator or software, and confirm that the test assumptions match your study design. For exploratory work and learning, the model is highly useful; for final reports or clinical decisions, use reproducible code and expert review.
Is ChatGPT good at choosing the right test from a photo?
It can be, when the photo clearly shows sample sizes, grouping, and whether measurements are paired. The risk comes when pairing, blocking, or units are hidden or ambiguous. If you see identifiers for the same subjects across two columns, assume paired methods might be needed; if those cues are absent, verify grouping before accepting a test recommendation. Always check selection against the visible evidence and recompute with the chosen test.
How should I check a p-value ChatGPT reports?
Ask ChatGPT to show the exact arithmetic it used: the test statistic, degrees of freedom, and whether the p-value is one- or two-sided. Then compute the p-value yourself with the same inputs using R (pt, pnorm, pchisq) or an online calculator. If ChatGPT didn’t show the degrees of freedom or the directionality of the test, don’t trust the reported p-value until you verify those pieces.
When should I consult a statistician instead of relying on ChatGPT?
Consult a statistician when the analysis affects major decisions, when study design confounders or causal claims are possible, when the data contain complex dependencies (hierarchical, longitudinal, networked), or when different reasonable analyses produce conflicting conclusions. Also seek expert review if the photo lacks key details (collection protocol, inclusion criteria, or measurement units) that materially change interpretation.