

AI Statistics Problem Solver: How the Solver Works and How to Check It
Understand what an ai statistics problem solver handles well, what it can’t prove from a picture, and how to verify calculations step by step.

What an AI statistics problem solver can do
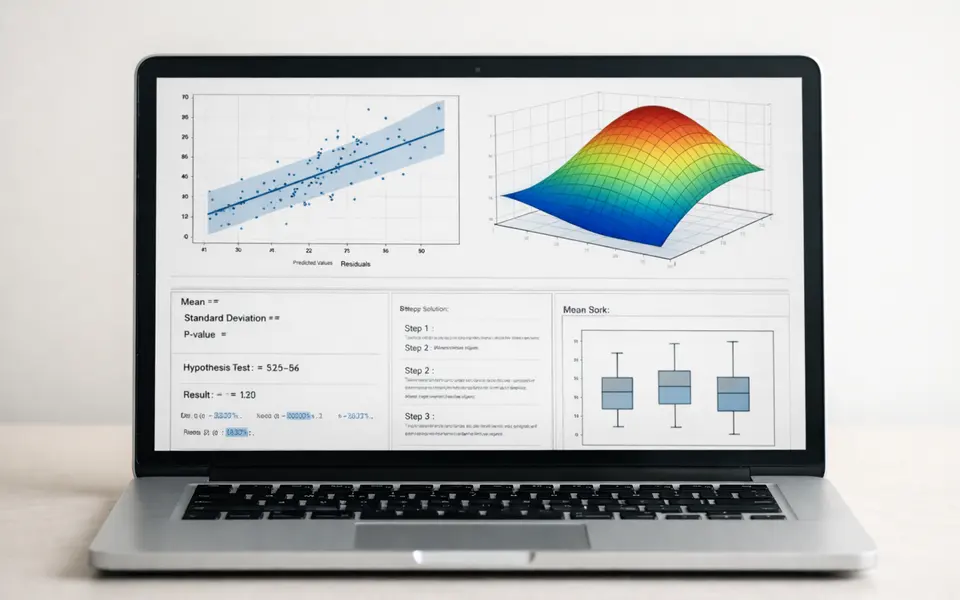
An ai statistics problem solver can read a photographed problem statement, extract numeric data, perform standard tests and produce step-by-step calculations if the input is clear. When a photo shows the full question, labeled variables, and a clean data table or clearly typed numbers, the solver can compute descriptive statistics (means, medians, standard deviations), fit common models (simple linear regression, t-tests, chi-square tests), and produce interpretable outputs like p-values, confidence intervals, and fitted coefficients.
The solver is particularly reliable for routine, well-specified tasks: arithmetic on lists of numbers, applying formulas for sample means and variance, calculating standard errors, running a two-sample t-test when group labels are present, or producing a regression summary when predictors and outcomes are obvious. It follows deterministic algebraic rules, so identical inputs yield identical numeric outputs — which makes it straightforward to check intermediate steps and reproduce results by hand or in a calculator.
Beyond raw calculations, an ai statistics problem solver can help organize a solution: it can list assumptions you should check (normality approximation, independence, equal variances), suggest which test or estimator matches the problem statement, and show how it arrived at a conclusion in human-readable steps. That explanatory trail is the core value: it helps you learn the statistics step by step and spot where an assumption or data entry error would change the result.
When you supply extra context — the study design, measurement units, whether data are paired, or the hypothesis direction — the solver’s recommendations get more accurate. For example, indicating that observations are repeated measures should switch the solver away from an independent-sample t-test to a paired-sample approach. Clear context reduces guesswork and improves the solver’s choice of method.
- Accurate for arithmetic and algebraic computations when inputs are complete and legible.
- Can recommend appropriate tests and models given explicit design details (paired vs independent, one- vs two-tailed).
- Produces step-by-step work that you can verify manually or reproduce in software.
- Flags common assumption checks (sample size, outliers, variance equality) but cannot run collection-stage tests without full data.
What an AI statistics problem solver cannot prove
An ai statistics problem solver cannot magically confirm facts that are outside the photographed text or underlying data. It cannot verify whether the data were collected honestly, whether measurement instruments were calibrated correctly, or whether a dataset contains hidden duplicates, transcription errors, or mis-labeled columns unless those issues appear in the image. In other words, it operates strictly on the inputs you give it; garbage in produces garbage out.
The solver also cannot guarantee the real-world applicability of a statistical result. A computed p-value or a statistically significant coefficient does not by itself prove causation, relevance, or practical importance. That judgment depends on study design, confounding variables, and domain knowledge that are not recoverable from a single screenshot or photograph of a homework problem.
Certain nuanced choices are beyond reliable automation without human verification: selecting the most defensible model among many plausible alternatives (for example, deciding between a generalized linear model and a transformation-based linear model), diagnosing subtle violations of assumptions from summary numbers alone, or assessing the impact of missing-not-at-random data require expert review or access to the raw dataset and collection protocol.
Finally, the solver cannot assert absolute correctness when it must infer missing details. If the problem omits whether groups are independent, the solver must assume one option and state that assumption; its resulting calculation may be correct under that assumption but wrong under another. Always treat inferred assumptions as checklist items to confirm before accepting the final answer as definitive.
- Cannot validate data provenance, measurement integrity, or whether the dataset is complete.
- Cannot prove causation or real-world significance from statistical outputs alone.
- Will make best-effort assumptions for missing design details; those assumptions need human confirmation.
- Not a substitute for expert review when model choice, bias sources, or data quality are in question.
Visual clues to capture for an AI statistics solver
If you intend to use an ai statistics solver from a photo or screenshot, capture the visual clues that most directly affect computation and interpretation. The highest-value details are: the complete problem statement, the full data table with row and column labels, units of measurement, any stated hypotheses (H0, H1), and the exact phrasing of sample selection or experimental design. Missing labels or truncated tables are the most common reasons a solver guesses incorrectly.
Photograph graphs and plots as supporting evidence, not as substitutes for raw numbers. Axes labels, tick marks, legends, and sample sizes printed on the figure let the solver cross-check descriptive calculations against visual summaries. If the plot uses log scales or shows transformed data, make sure that transformation is visible in the caption or axis label; otherwise the solver might treat plotted values as raw numbers and produce misleading results.
Screenshots of calculator or software output are especially helpful: captured intermediate outputs like sums of squares, ANOVA tables, regression residuals, or a calculator's keypad history let the solver trace computations step by step. When a student problem includes teacher-provided partial results, photograph them so the solver can check arithmetic and identify transcription errors rather than re-deriving from incomplete scratch.
Provide contextual metadata when possible: the number of observations (n), whether data are paired, whether randomization or cluster sampling occurred, and any exclusion criteria. If the problem involves probabilities or distributions, include parameter values (mean, variance, degrees of freedom). These clues reduce ambiguous assumptions and make the solver’s method selection and explanation more dependable.
- Full problem text and exact wording of hypotheses.
- Complete data tables with headers, units, and sample sizes.
- Axes labels, legends, and scale type (linear vs log) on any figures.
- Screenshots of intermediate calculator or software outputs.
- Metadata: paired vs independent, sampling method, exclusion rules.
How to verify solver output step by step
Treat the ai statistics problem solver as a proof-reading and teaching tool: always re-run the key arithmetic and check assumptions manually before citing results. Start by confirming that the solver used the exact numbers you provided. Recompute a few intermediate values — sample means, sum of squares, or a single t-statistic — by hand or with a basic calculator. If these micro-checks match, the remaining derived values are more likely to be correct.
Next, validate the method choice. Did the solver pick a paired test when the problem says measurements are before-and-after? Did it select a two-sided alternative when the question asked for directionality? If the method seems plausible but not certain, recompute the primary result under the alternate reasonable choice (for example, paired vs independent) and note how conclusions change. Large changes indicate the need for clarifying context from the problem author.
Inspect assumption-sensitive diagnostics. If a t-test or regression was run, check residual summaries, sample sizes, and variance comparisons. For small samples, normality approximations break down; document whether the solver’s output relied on asymptotic approximations and consider non-parametric checks if warranted. For regression, look for leverage points and influential observations: a single outlier can drastically affect coefficients.
When stakes are high — graded assignments, research reports, or decisions tied to money or safety — escalate verification. Re-run the analysis with independent software (R, Python, or a statistical calculator) using the typed dataset; ask a teacher, TA, or domain expert to confirm model choice and interpretation. Use Statistics AI: Statikia as a guided second opinion that surfaces steps to check, but complete the verification loop with reproducible code or human review when necessary.
- Recompute a few intermediate numbers by hand to confirm inputs and arithmetic.
- Confirm the solver’s chosen test or model matches the study design.
- Check diagnostics (residuals, sample size warnings, variance checks) for assumption violations.
- If results would change decisions, re-run the analysis in independent software and seek expert review.
Related guides
Use Statistics AI: Statikia to check the steps, not skip them
Capture the full problem text, data table, and any calculator outputs on your phone, then use Statistics AI: Statikia on iOS to scan and verify every intermediate step. The app highlights assumptions, shows how each value was computed, and points to the one or two checks that matter most for your problem. Treat its output as a careful second opinion: confirm arithmetic manually or in independent software and consult an instructor when results affect grades, research, or decisions.
Take the next step →Frequently asked questions
Can an AI statistics solver show its work so I can check each step?
Yes — most ai statistics problem solver tools can produce step-by-step calculations and justify method choices, which makes verification possible. Use those steps to re-run intermediate arithmetic, confirm which formulas were used, and check the solver’s assumptions. If a step is unclear or an intermediate value is missing, request the specific calculation (for instance, ask for the sum of squares or the mean calculation) so you can verify it independently.
What should I do if the solver’s answer contradicts my manual calculation?
First, scan for differences in inputs: rounding, transcription errors, or omitted rows in the photographed data are common causes. If inputs match, compare the exact formula and degrees of freedom used. Recompute the contested value with a simple calculator and, if disagreement persists, re-run the analysis in an independent package (like R or a trusted statistics calculator). Where ambiguity remains, document both results and ask an instructor or peer to interpret the discrepancy.
Can the solver tell if the data are biased or invalid?
No — the solver can highlight indicators of bias (extreme skewness, suspiciously repeated values, or improbable uniformity) but cannot definitively establish bias or data fraud from an image alone. Detecting bias typically requires access to collection protocols, raw timestamps, metadata, or cross-validation against external sources. Treat solver warnings as prompts for deeper investigation, not final proof of bias.
How can I prompt the tool to give the most useful verification steps?
Provide complete problem text, full data tables, and any known context (paired vs independent, sampling method, measurement units). Ask the solver explicitly for intermediate calculations, assumption checks, and alternative analyses (for example: 'Show the mean and variance computation; test normality; run a non-parametric alternative.'). Structured prompts that request both the numeric results and the diagnostic checks yield the clearest, most verifiable outputs.